High School: Statistics & Probability
More Specific Topics in High School: Statistics & Probability
Popular Tutorials in High School: Statistics & Probability
-
What Does the Slope of a Line Mean?
You can't learn about linear equations without learning about slope. The slope of a line is the steepness of the line. There are many ways to think about slope. Slope is the rise over the run, the change in 'y' over the change in 'x', or the gradient of a line. Check out this tutorial to learn about slope!
-
What's Positive Correlation?
Looking at a line-of-fit on a scatter plot? Does that line have a positive slope? If so, your data shows a positive correlation! Learn about positive correlation by watching this tutorial.
-
What's Negative Correlation?
Looking at a line-of-fit on a scatter plot? Does that line have a negative slope? If so, your data shows a negative correlation! Learn about negative correlation by watching this tutorial.
-
What Does it Mean To Have No Correlation?
Scatter plots are very helpful in graphically showing the pattern in a set of data. But sometimes that data shows no correlation. Learn about no correlation and see how to tell if data shows no correlation by watching this tutorial!
-
How Do You Find the Probability of Independent Events?
Calculating probabilities? Take a look at this tutorial and see how to figure out the probability of independently drawing certain cards from a deck!
-
How Do You Find the Mean of a Data Set?
Mean is just another name for average. To find the mean of a data set, add all the values together and divide by the number of values in the set. The result is your mean! To see an example of finding the mean, watch this tutorial!
-
How Do You Find the Median of a Data Set?
The median of a data set is the number that is the middle value of the set. It's easy to find the median if you first put the numbers in order from least to greatest. In this tutorial, see how to find the median of a data set, and see what to do if there are two middle values!
-
How Do You Make a Histogram?
If you want to see data from a frequency table in a more visual way, try creating a histogram to show off that data! This tutorial shows you what to do!
-
How Do You Make a Box-and-Whisker Plot?
A box-and-whisker plot can help you get a better picture of what your data looks like visually. This tutorial shows you the step-by-step process for making a box-and-whisker plot!
-
How Do You Find the Probability of the Complement of an Event?
Probability can help you solve all sorts of everyday problems! This tutorial shows you how to find the probability of the complement of an event using gummy worms!
-
How Do You Use a Simulation to Solve a Problem?
Simulators are a great way to model an experiment without actually performing the experiment in real life. This tutorial looks at using a simulator to figure out what might happen if you randomly guessed on a true/false quiz.
-
What is an Outcome?
When you're conducting an experiment, the outcome is a very important part. The outcome of an experiment is any possible result of the experiment. Learn about outcomes by watching this tutorial!
-
What is a Sample Space?
In an experiment, it's good to know your sample space. The sample space is the set of all possible outcomes of an experiment. Watch this tutorial to get a look at the sample space of an experiment!
-
What is the Median of a Data Set?
The median is one of many measures of central tendency. Check out this tutorial to learn what the median is and how you can find it!
-
What is the Mean of a Data Set?
When you think of the mean of a data set, think of the word average. 'Mean' and 'average' are the same thing when you're talking about a set of data! This tutorial introduces you to mean and shows you how to find it!
-
What is a Histogram?
Looking for info on histograms? Check this out:
-
What is the Interquartile Range?
Being able to disect a set of data and better understand it is a key part of mastering statistics. This tutorial teaches you about one of these disection tools called the interquartile range.
-
What is the Complement of an Event?
When you learn about probablilities, the complement of an event is a must-know term! This tutorial introduces you the complement of an event.
-
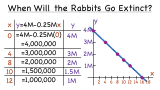
How Do You Use the Graph of a Linear Equation to Solve a Word Problem?
Word problems are a great way to see math in the real world! In this tutorial, see how to figure out how long it will take for a rabbit population to go extinct. You'll also see how to set up a table and a graph to help find the answer!
-
How Do You Find Conditional Probability?
Conditional probability is used to find a probability in all sorts of everyday situations! This tutorial shows you one example of how to find the conditional probability in a real world problem.
-
How Do You Find the Standard Deviation of a Data Set?
Organization is a key part of finding the standard deviation of a data set. This tutorial takes you through the entire process one step at a time!
-
What is Conditional Probability?
If you're learning about probability, conditional probability is bound to come up. This tutorial explains conditional probability and shows you how to find it!
-
What is a Normal Distribution?
Ever heard of data following a normal distribution? How do you know if you're data follows normal distribution? This tutorial introduces normal distribution and shows you the characteristics of a normal distribution curve!
-
How Do You Find the Rate of Change Between Two Points on a Graph?
The rate of change is a rate that describes how one quantity changes in relation to another quantity. In this tutorial, practice finding the rate of change using a graph. Check it out!
-
How Do You Write and Use a Prediction Equation?
Scatter plots are a great way to see data visually. They can also help you predict values! Follow along as this tutorial shows you how to draw a line of fit on a scatter plot and find the equation of that line in order to make a prediction based on the data already given!
-
What is Rate of Change?
Trying to describe the how something changes in relation to something else? Use rate of change! In this tutorial, learn about rate of change and see the difference between positive and negative rates of change!
-
What is an Unbiased Sample?
When you're trying to learn about a population, it can be helpful to look at an unbiased sample. An unbiased sample can be an accurate representation of the entire population and can help you draw conclusions about the population. This tutorial introduces you to unbiased sampling!