Graph functions expressed symbolically and show key features of the graph, by hand in simple cases and using technology for more complicated cases.
More Specific Topics in Graph functions expressed symbolically and show key features of the graph, by hand in simple cases and using technology for more complicated cases.
Popular Tutorials in Graph functions expressed symbolically and show key features of the graph, by hand in simple cases and using technology for more complicated cases.
-
How Do You Graph an Absolute Value Function?
Graphing an absolute value equation can be complicated, unless you know how to dissect the equation to find and use the slope and translations. Follow along as this tutorial shows you how to identify the necessary parts of the equation and use them to graph the absolute value equation.
-
What is an Absolute Value Function?
An absolute value function is just a function that contains absolute values. This tutorial gives a great introduction to this very useful function!
-
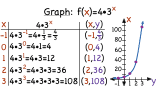
How Do You Graph an Exponential Function Using a Table?
Graphing an exponential function? No sweat! Create a table of values to give you ordered pairs. Then, plot those ordered pair on a coordinate plane and connect the points to make your graph! Follow along with this tutorial as it shows you all the steps.
-
What's an Exponential Function?
Looking at an equation with a variable in the exponent? You have an exponential function! Learn about exponential functions in this tutorial.
-
How Do You Graph a Rational Function by Making a Table?
Graphing a rational function can be fun, especially when you make a table of values first! In this tutorial, you'll see how to make a table of ordered pairs that you can use to graph the rational function. Take a look!
-
How Do You Graph a Vertical Line?
To graph a vertical line that goes through a given point, first plot that point. Then draw a straight line up and down that goes through the point, and you're done! To see this process in action, watch this tutorial!
-
How Do You Graph a Horizontal Line?
To graph a horizontal line that goes through a given point, first plot that point. Then draw a straight line left and right that goes through the point, and you're done! To see this process in action, watch this tutorial!
-
How Do You Use X- and Y-Intercepts To Graph a Line In Standard Form?
To find the x-intercept of a given linear equation, simply remove the 'y' and solve for 'x'. To find the y-intercept, remove the 'x' and solve for 'y'. In this tutorial, you'll see how to find the x-intercept and the y-intercept for a given linear equation. Check it out!
-
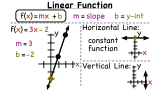
How Do You Graph a Line If You're Given the Slope and the Intercept?
Trying to graph a line from a given slope and y-intercept? Think you need to find an equation first? Think again! In this tutorial, see how to use that given slope and y-intercept to graph the line.
-
What's the X-Intercept?
When you have a linear equation, the x-intercept is the point where the graph of the line crosses the x-axis. In this tutorial, learn about the x-intercept. Check it out!
-
What's the Y-Intercept?
When you have a linear equation, the y-intercept is the point where the graph of the line crosses the y-axis. In this tutorial, learn about the y-intercept. Check it out!
-
How Do You Find the Zeros of a Quadratic Function on a Graph?
The zeros of a quadratic equation are the points where the graph of the quadratic equation crosses the x-axis. In this tutorial, you'll see how to use the graph of a quadratic equation to find the zeros of the equation. Take a look!
-
How Do You Graph a Quadratic Function?
When you're trying to graph a quadratic equation, making a table of values can be really helpful. Before you make a table, first find the vertex of the quadratic equation. That way, you can pick values on either side to see what the graph does on either side of the vertex. Watch this tutorial to see how you can graph a quadratic equation!
-
How Do You Determine if the Vertex Will Be a Maximum or Minimum?
The vertex of a quadratic equation is either a maximum or a minimum of the function. But how do you tell if it will be a maximum or a minimum? Watch this tutorial and find the answer to that question!
-
What is the Vertex of a Quadratic Function?
Each quadratic equation has either a maximum or minimum, but did you that this point has a special name? In a quadratic equation, this point is called the vertex! Take a look at the vertex of a quadratic equation by watching this tutorial.
-
What is the Maximum of a Quadratic Function?
When you're dealing with quadratic functions, maximum and minimum are very likely to come up. This tutorial takes a look at the maximum of a quadratic function. Check it out!
-
What is the Minimum of a Quadratic Function?
When you're dealing with quadratic functions, maximum and minimum are very likely to come up. This tutorial takes a look at the minimum of a quadratic function. Check it out!
-
What is a Quadratic Function?
You can't go through algebra without seeing quadratic functions. The graphs of quadratic functions are parabolas; they tend to look like a smile or a frown. In this tutorial, get introduced to quadratic functions, look at their graphs, and see some examples of quadratic functions!
-
How Do You Graph a Square Root Function Using a Table?
Making a table of values is a useful way to graph a square root function. Just remember to choose x-values for which the function is defined! Watch the tutorial to find out more.
-
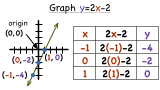
How Do You Graph a Linear Equation by Making a Table?
Graphing a function? It would be really helpful if you had a table of values that fit your equation. You could plot those values on a coordinate plane and connect the point to make your graph. See it all in this tutorial!
-
How Do You Graph a Piecewise Function?
If you want to graph a piecewise linear function, graph each function on it's specific interval separately. Bring it all together, and you have your graph! This tutorial shows you the entire process for graphing a piecewise linear function.
-
What is the Parent Function of a Cubic Function?
The graph of a linear function is a line. The graph of a quadratic function is a parabola. What does the graph of a cubic function look like? This tutorial introduces you to the basic (parent) function for cubic functions!
-
How Do You Graph a Quadratic Equation in Intercept Form?
Graphing a quadratic equation in intercept form is a breeze! All the information you need is in the equation. You just need to pick it out and use it. Follow along with this tutorial to see how to take an equation intercept form and use it to find the x-intercepts, vertex, and axis of symmetry.
-
How Do You Graph a Polynomial Function by Making a Table?
How could you graph a complicated polynomial function? By making a table of course! In this tutorial, you'll see how a table is made and used to graph a higher order polynomial function.
-
How Do You Graph the Natural Base Exponential Function?
Want to graph a natural base exponential function? Make a table of points! Then plot the points, connect them, and you have your graph! Follow along with this tutorial to see the entire process step-by-step.
-
What is the Natural Base Exponential Function?
The natural base exponential function is actually a function that's shorter than its name! This tutorial introduces you to this special function and shows you what it looks like.
-
What Does the Graph of the Cosine Function Look Like?
You can use the unit circle to help you graph the cosine function! In this tutorial, you'll learn how to do exactly that!
-
What Does the Graph of the Tangent Function Look Like?
If you want to make the graph of the tangent function, you can use the unit circle to help you plot points. This tutorial shows you how to use the unit circle to make the tangent function graph!
-
What is a Periodic Function?
Periodic functions have some special qualities! In this tutorial, you'll be introduced to these functions and learn what a graph must have to be called a periodic function.
-
How Do You Horizontally Translate a Trigonometric Graph?
Translating a graph of sine or cosine horizontally can be fun, but you need to understand how it works. Follow along with this tutorial to learn how to horizontally shift the sine and cosine graphs!