represent linear relationships using verbal descriptions, tables, graphs, and equations that simplify to the form y = mx + b
Popular Tutorials in represent linear relationships using verbal descriptions, tables, graphs, and equations that simplify to the form y = mx + b
-
What's the Y-Intercept?
When you have a linear equation, the y-intercept is the point where the graph of the line crosses the y-axis. In this tutorial, learn about the y-intercept. Check it out!
-
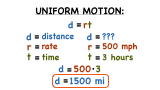
What's the Formula Connecting Distance, Speed, and Time?
When you have constant speed, the same formula pops up over and over again, and that's the formula that connects distance, speed, and time. Make sure you know this formula, and if you want a refresher, check out the tutorial!
-
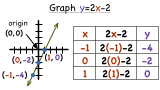
How Do You Graph a Linear Equation by Making a Table?
Graphing a function? It would be really helpful if you had a table of values that fit your equation. You could plot those values on a coordinate plane and connect the point to make your graph. See it all in this tutorial!
-
How Do You Find the Rate of Change Between Two Points on a Graph?
The rate of change is a rate that describes how one quantity changes in relation to another quantity. In this tutorial, practice finding the rate of change using a graph. Check it out!