How Do You Graph a Linear Equation by Making a Table?
Note:
Graphing a function? It would be really helpful if you had a table of values that fit your equation. You could plot those values on a coordinate plane and connect the point to make your graph. See it all in this tutorial!
Background Tutorials
-
select tools, including real objects, manipulatives, paper and pencil, and technology as appropriate, and techniques, including mental math, estimation, and number sense as appropriate, to solve problems
-
What's the Order of Operations?
Check out this tutorial where you'll see exactly what order you need to follow when you simplify expressions. You'll also see what happens when you don't follow these rules, and you'll find out why order of operations is so important!
-
-
Determine the slope of a line given a table of values, a graph, two points on the line, and an equation written in various forms, including y = mx + b, ax + by = c, and y - y1 = m(x - x1)
-
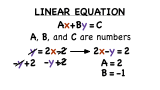
What's Standard Form of a Linear Equation?
A linear equation can be written in many different forms, and each of them is quite useful! One of these is standard form. Watch this tutorial and learn the standard form for a linear equation!
-


Further Exploration
-
Determine the slope of a line given a table of values, a graph, two points on the line, and an equation written in various forms, including y = mx + b, ax + by = c, and y - y1 = m(x - x1)
-
How Do You Find the Slope of a Line from a Graph?
Trying to find the slope of a graphed line? First, identify two points on the line. Then, you could use these points to figure out the slope. In this tutorial, you'll see how to use two points on the line to find the change in 'y' and the change in 'x'. Then, you'll see how to take these values and calculate the slope. Check it out!
-

