Interpret linear models.
More Specific Topics in Interpret linear models.
Popular Tutorials in Interpret linear models.
-
What Does the Slope of a Line Mean?
You can't learn about linear equations without learning about slope. The slope of a line is the steepness of the line. There are many ways to think about slope. Slope is the rise over the run, the change in 'y' over the change in 'x', or the gradient of a line. Check out this tutorial to learn about slope!
-
What's Positive Correlation?
Looking at a line-of-fit on a scatter plot? Does that line have a positive slope? If so, your data shows a positive correlation! Learn about positive correlation by watching this tutorial.
-
What's Negative Correlation?
Looking at a line-of-fit on a scatter plot? Does that line have a negative slope? If so, your data shows a negative correlation! Learn about negative correlation by watching this tutorial.
-
What Does it Mean To Have No Correlation?
Scatter plots are very helpful in graphically showing the pattern in a set of data. But sometimes that data shows no correlation. Learn about no correlation and see how to tell if data shows no correlation by watching this tutorial!
-
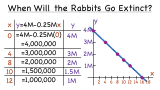
How Do You Use the Graph of a Linear Equation to Solve a Word Problem?
Word problems are a great way to see math in the real world! In this tutorial, see how to figure out how long it will take for a rabbit population to go extinct. You'll also see how to set up a table and a graph to help find the answer!
-
How Do You Find the Rate of Change Between Two Points on a Graph?
The rate of change is a rate that describes how one quantity changes in relation to another quantity. In this tutorial, practice finding the rate of change using a graph. Check it out!
-
What is Rate of Change?
Trying to describe the how something changes in relation to something else? Use rate of change! In this tutorial, learn about rate of change and see the difference between positive and negative rates of change!