Understand that the graph of an equation in two variables is the set of all its solutions plotted in the coordinate plane, often forming a curve (which could be a line).
Popular Tutorials in Understand that the graph of an equation in two variables is the set of all its solutions plotted in the coordinate plane, often forming a curve (which could be a line).
-
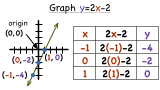
How Do You Graph a Linear Equation by Making a Table?
Graphing a function? It would be really helpful if you had a table of values that fit your equation. You could plot those values on a coordinate plane and connect the point to make your graph. See it all in this tutorial!
-
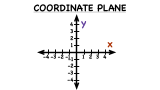
What is the Coordinate Plane?
You can't graph a function or plot ordered pairs without a coordinate plane! Learn about the coordinate plane by watching this tutorial.
-
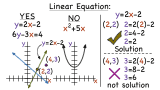
What is a Linear Equation?
If you're learning about graphs, you're bound to see a bunch of linear equations, so it's a good idea to understand what makes an equation a linear equation. This tutorial explains linear equations and shows you the difference between equations that are linear and ones that are not. Check it out!