What's a Scatter Plot?
Note:
Scatter plots are really useful for graphically showing a bunch of data. By seeing data graphically, you can see patterns or trends in the data. These patterns help researchers to understand how one thing affects another. This can lead to all kinds of breakthroughs! This tutorial gives you a look at the scatter plot. Check it out!
Background Tutorials
-
Use a pair of perpendicular number lines, called axes, to define a coordinate system, with the intersection of the lines (the origin) arranged to coincide with the 0 on each line and a given point in the plane located by using an ordered pair of numbers, called its coordinates. Understand that the first number indicates how far to travel from the origin in the direction of one axis, and the second number indicates how far to travel in the direction of the second axis, with the convention that the names of the two axes and the coordinates correspond (e.g., x-axis and x-coordinate, y-axis and y-coordinate).
-
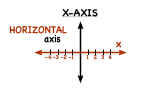
What is the X-Axis?
To graph a function or plot an ordered pair, you need to use a coordinate plane, so you should learn all about it! In this tutorial, you'll learn about the x-axis and see where it's located in the coordinate plane.
-
-
Understand signs of numbers in ordered pairs as indicating locations in quadrants of the coordinate plane; recognize that when two ordered pairs differ only by signs, the locations of the points are related by reflections across one or both axes.
-
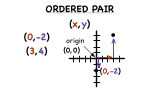
What is an Ordered Pair?
Ordered pairs are a fundamental part of graphing. Ordered pairs make up functions on a graph, and very often, you need to plot ordered pairs in order to see what the graph of a function looks like. This tutorial will introduce you to ordered pairs!
-
-
Construct and interpret scatter plots for bivariate measurement data to investigate patterns of association between two quantities. Describe patterns such as clustering, outliers, positive or negative association, linear association, and nonlinear association.
-
How Do You Use a Scatter Plot to Find a Positive Correlation?
Got a bunch of data? Trying to figure out if there is a positive, negative, or no correlation? Draw a scatter plot! This tutorial takes you through the steps of creating a scatter plot, drawing a line-of-fit, and determining the correlation, if any. Take a look!
-