What's a Scatter Plot?
Note:
Scatter plots are really useful for graphically showing a bunch of data. By seeing data graphically, you can see patterns or trends in the data. These patterns help researchers to understand how one thing affects another. This can lead to all kinds of breakthroughs! This tutorial gives you a look at the scatter plot. Check it out!
Background Tutorials
-
Graphing in the Coordinate Plane
-
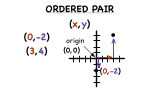
What is an Ordered Pair?
Ordered pairs are a fundamental part of graphing. Ordered pairs make up functions on a graph, and very often, you need to plot ordered pairs in order to see what the graph of a function looks like. This tutorial will introduce you to ordered pairs!
-
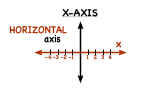
What is the X-Axis?
To graph a function or plot an ordered pair, you need to use a coordinate plane, so you should learn all about it! In this tutorial, you'll learn about the x-axis and see where it's located in the coordinate plane.
-
-
Finding Correlations with Scatter Plots
-
How Do You Use a Scatter Plot to Find a Positive Correlation?
Got a bunch of data? Trying to figure out if there is a positive, negative, or no correlation? Draw a scatter plot! This tutorial takes you through the steps of creating a scatter plot, drawing a line-of-fit, and determining the correlation, if any. Take a look!
-